

My name is William Huffman and I LOVE data. Here is a graphic and I am going to give you a quick explanation of what it represents and what I think it means.
The 2 graphics you will see below are for the 16-county Twin Cities areas, it compiles all of the data on the MLS (Multiple Listing Service) and Showing Time, the program we use to request showings as Realtors.
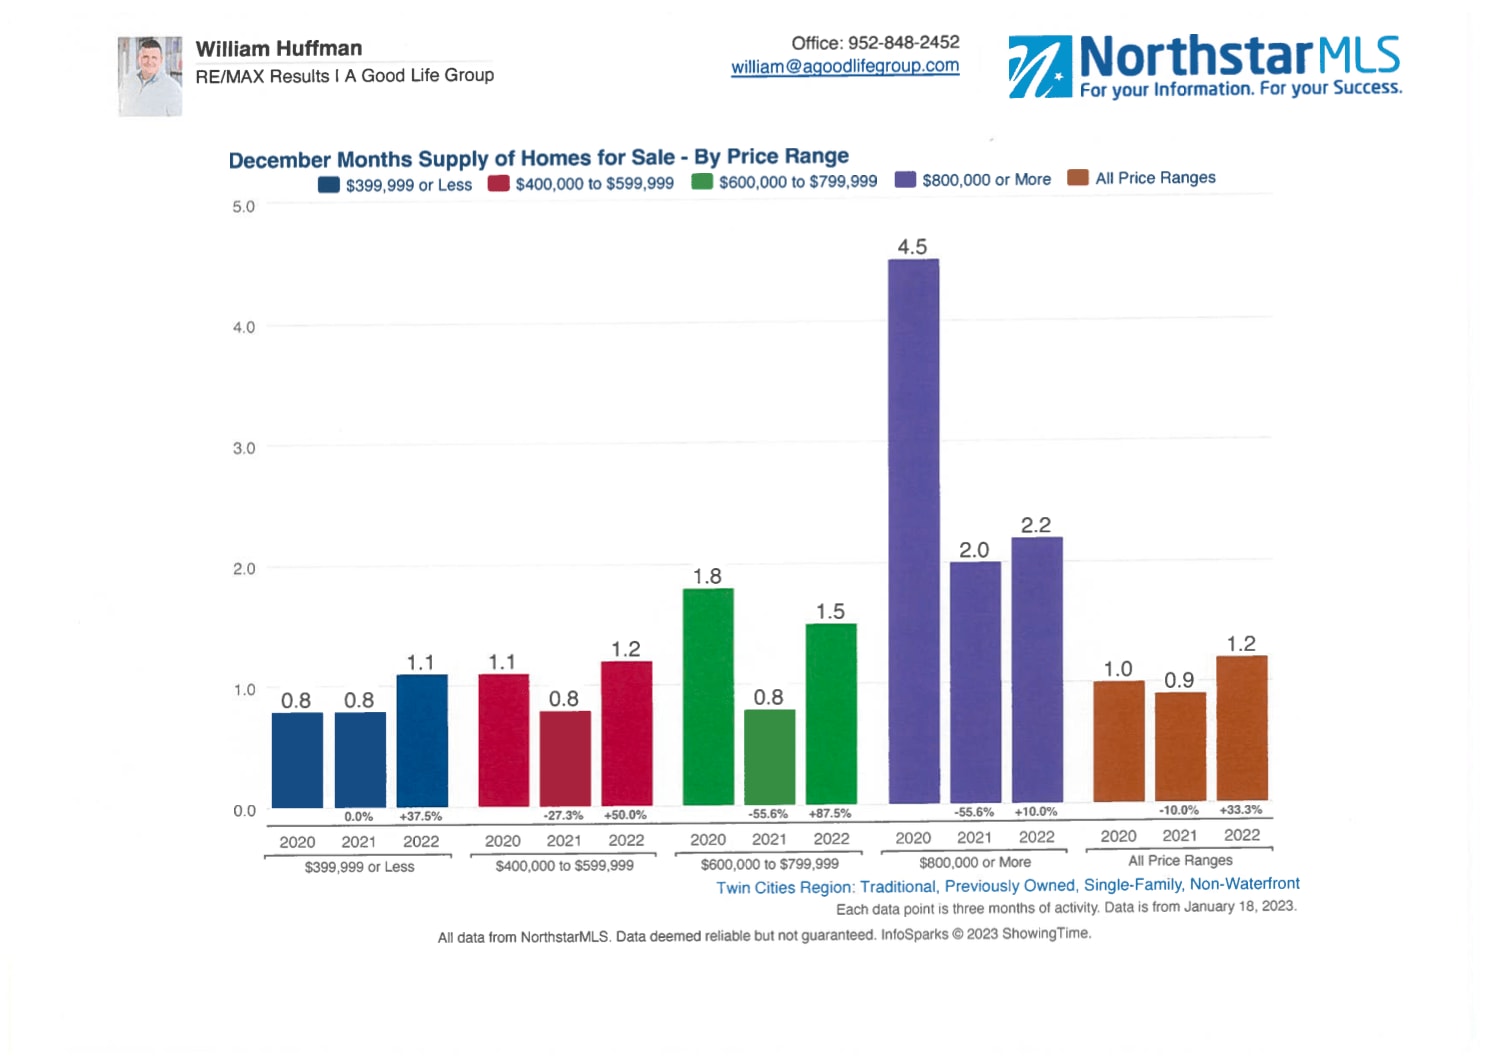
I have broken this down into 2 graphics. The first one is previously owned (not new construction), single-family non-waterfront homes that are traditional sales (no foreclosures). You will see these criteria in the bottom right-hand corner. The second one is new construction, single-family, non-waterfront homes.
I could talk for hours on this, with that in mind, I am going to give a very quick breakdown. If you want to know more, please contact me directly at [email protected] or on my cell phone at 651-278-2089.
What you are looking at is a 3-year, year-over-year infographic that is a rolling average of the last 3 months of data from each year broken down into 4 price ranges. So this data is from October, November, and December of 2020, 2021, and 2022. You get a really good idea of the trends year-over-year. Also, I am only choosing 3 months of rolling data vs. 12 months of rolling data because of how interesting the market has been.
Are we still in a seller's market? Well, yes and no... Simple right? We define a seller's market as having less than 4 months of inventory and a buyer's market as there is more than 6 months of inventory and a balanced market right around 5 months of inventory... I bet you are asking yourself, "What the heck does that mean?" If no new homes came on the market and people keep buying homes at the same pace they are right now, how long will it take until we run out of homes (inventory)? Say, 10 homes sell a month and we have 40 homes for sale. We have 4 months of inventory. Does that make more sense?
Okay, so now that we have a basic understanding of where I am coming from let's look at the first chart which is pre-existing homes. IF we were to only look at this data, we would think we are clearly still in a seller's market.
Now, let's look at new construction. The new construction data shows that we are CLEARLY in a buyer's market because we have a ton of inventory. So, who is right?!
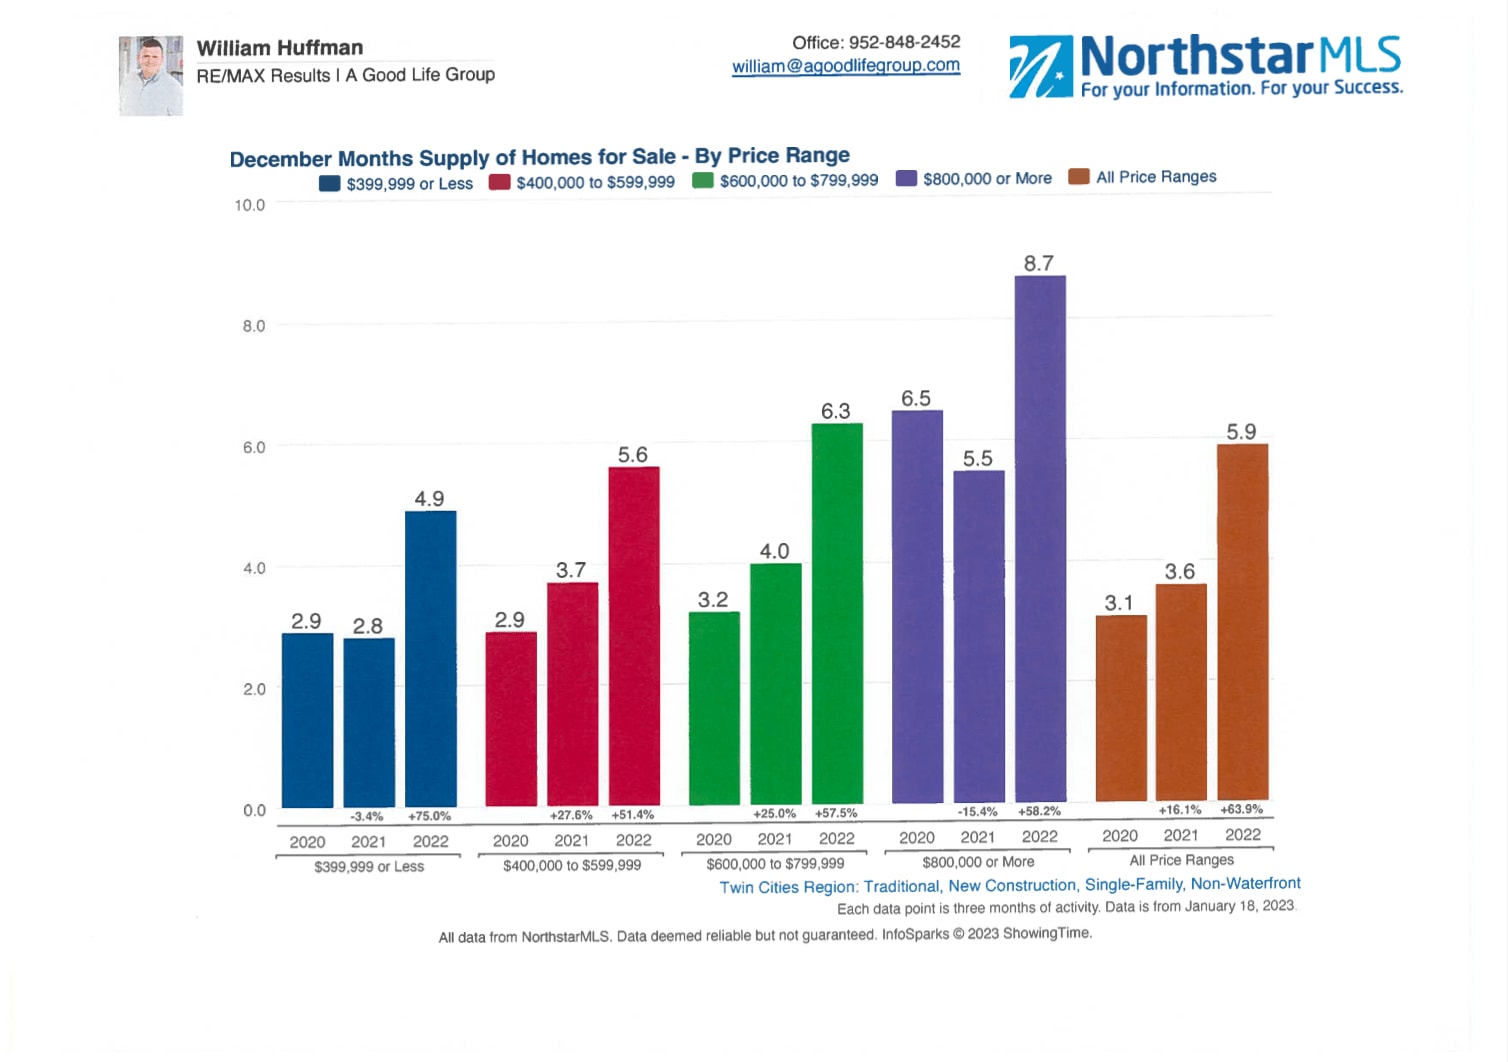
The answer is both are right AND wrong, kind of. People buying new construction are not typically the same people looking at existing homes, so the buyer pools are different demographics. Even though they may not be looking for the same homes, people will compare the two and prices will have to be competitive. A new construction home has no window treatments and an unfinished basement but has an open floor plan and new appliances. I could go on and on about the difference in the buyer pools and how to attract them, but for now, I will stick to this.
I am going to wrap this up, and I have probably left you with more questions than answers and that is okay. Is it a good time to sell or buy? That depends on what your motivation is. I wouldn't call it a buyer's market right now, with that being said, it is a better time to buy than it has been in the last two years. I wouldn't call it a seller's market, with that being said, your home's value has skyrocketed in value the last 2 years and has more equity than ever.
Long of the short is, call me. Let me nerd out on the data for your specific needs.